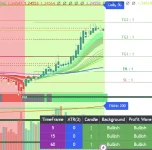
Indicator Binocular Trend for TradingView

The “Binocular” indicator is a comprehensive TradingView script designed for multiple purposes, including trend analysis, volatility tracking, and support/resistance identification. Here’s an overview of its functionalities:
1. Volatility Tracking and Settlement Levels:
- Settlement and Standard Deviation Levels: It calculates daily settlement levels and overlays up to three standard deviation levels (+0.5 SD, +1 SD, etc.) around the settlement price.
- Historical Volatility (HV): Computes annualized volatility based on daily or intraday data, which helps in assessing market conditions.
2. Trend Analysis:
- EMA Crossovers: Includes multiple EMAs (e.g., 30, 35, 40, 45, etc.) to identify the trend direction through crossovers.
- Supertrend: Utilizes the Supertrend indicator to highlight directional bias.
- Trend Coloring: Changes bar or background colors based on conditions like EMA positioning relative to the price.
3. Support/Resistance Zones:
- Demand/Supply Zones: Detects swing highs/lows and plots supply/demand areas with labels (e.g., “HH” for higher high, “LL” for lower low). These zones are extended forward until invalidated.
4. Trade Signal Generation:
- Buy/Sell Signals: Combines volatility, trend, and RSI conditions to generate buy/sell signals. It also marks entry points and target levels on the chart.
- Stop Loss and Take Profit: Plots stop-loss and multiple take-profit levels based on recent high/low swings and ATR-based calculations.
5. VWAP Integration:
- Daily/Weekly/Monthly VWAP: Visualizes Volume Weighted Average Prices for different timeframes to identify key support/resistance levels.
6. Customizable Tables:
- Displays tables with RSI readings for multiple timeframes, MTF (multi-timeframe) trade signals, and profit/loss data.
7. ZigZag Indicator:
- Plots zigzag lines based on pivot highs and lows, aiding in visualizing swing structure and potential trend reversals.
8. Utility Features:
- User Input Controls: Highly customizable with various input options for visualization (e.g., enable/disable specific features, adjust lengths and thresholds).
- Multi-Timeframe Compatibility: Retrieves data from higher or lower timeframes for comparison and analysis.
Reseller
Price: 19$
